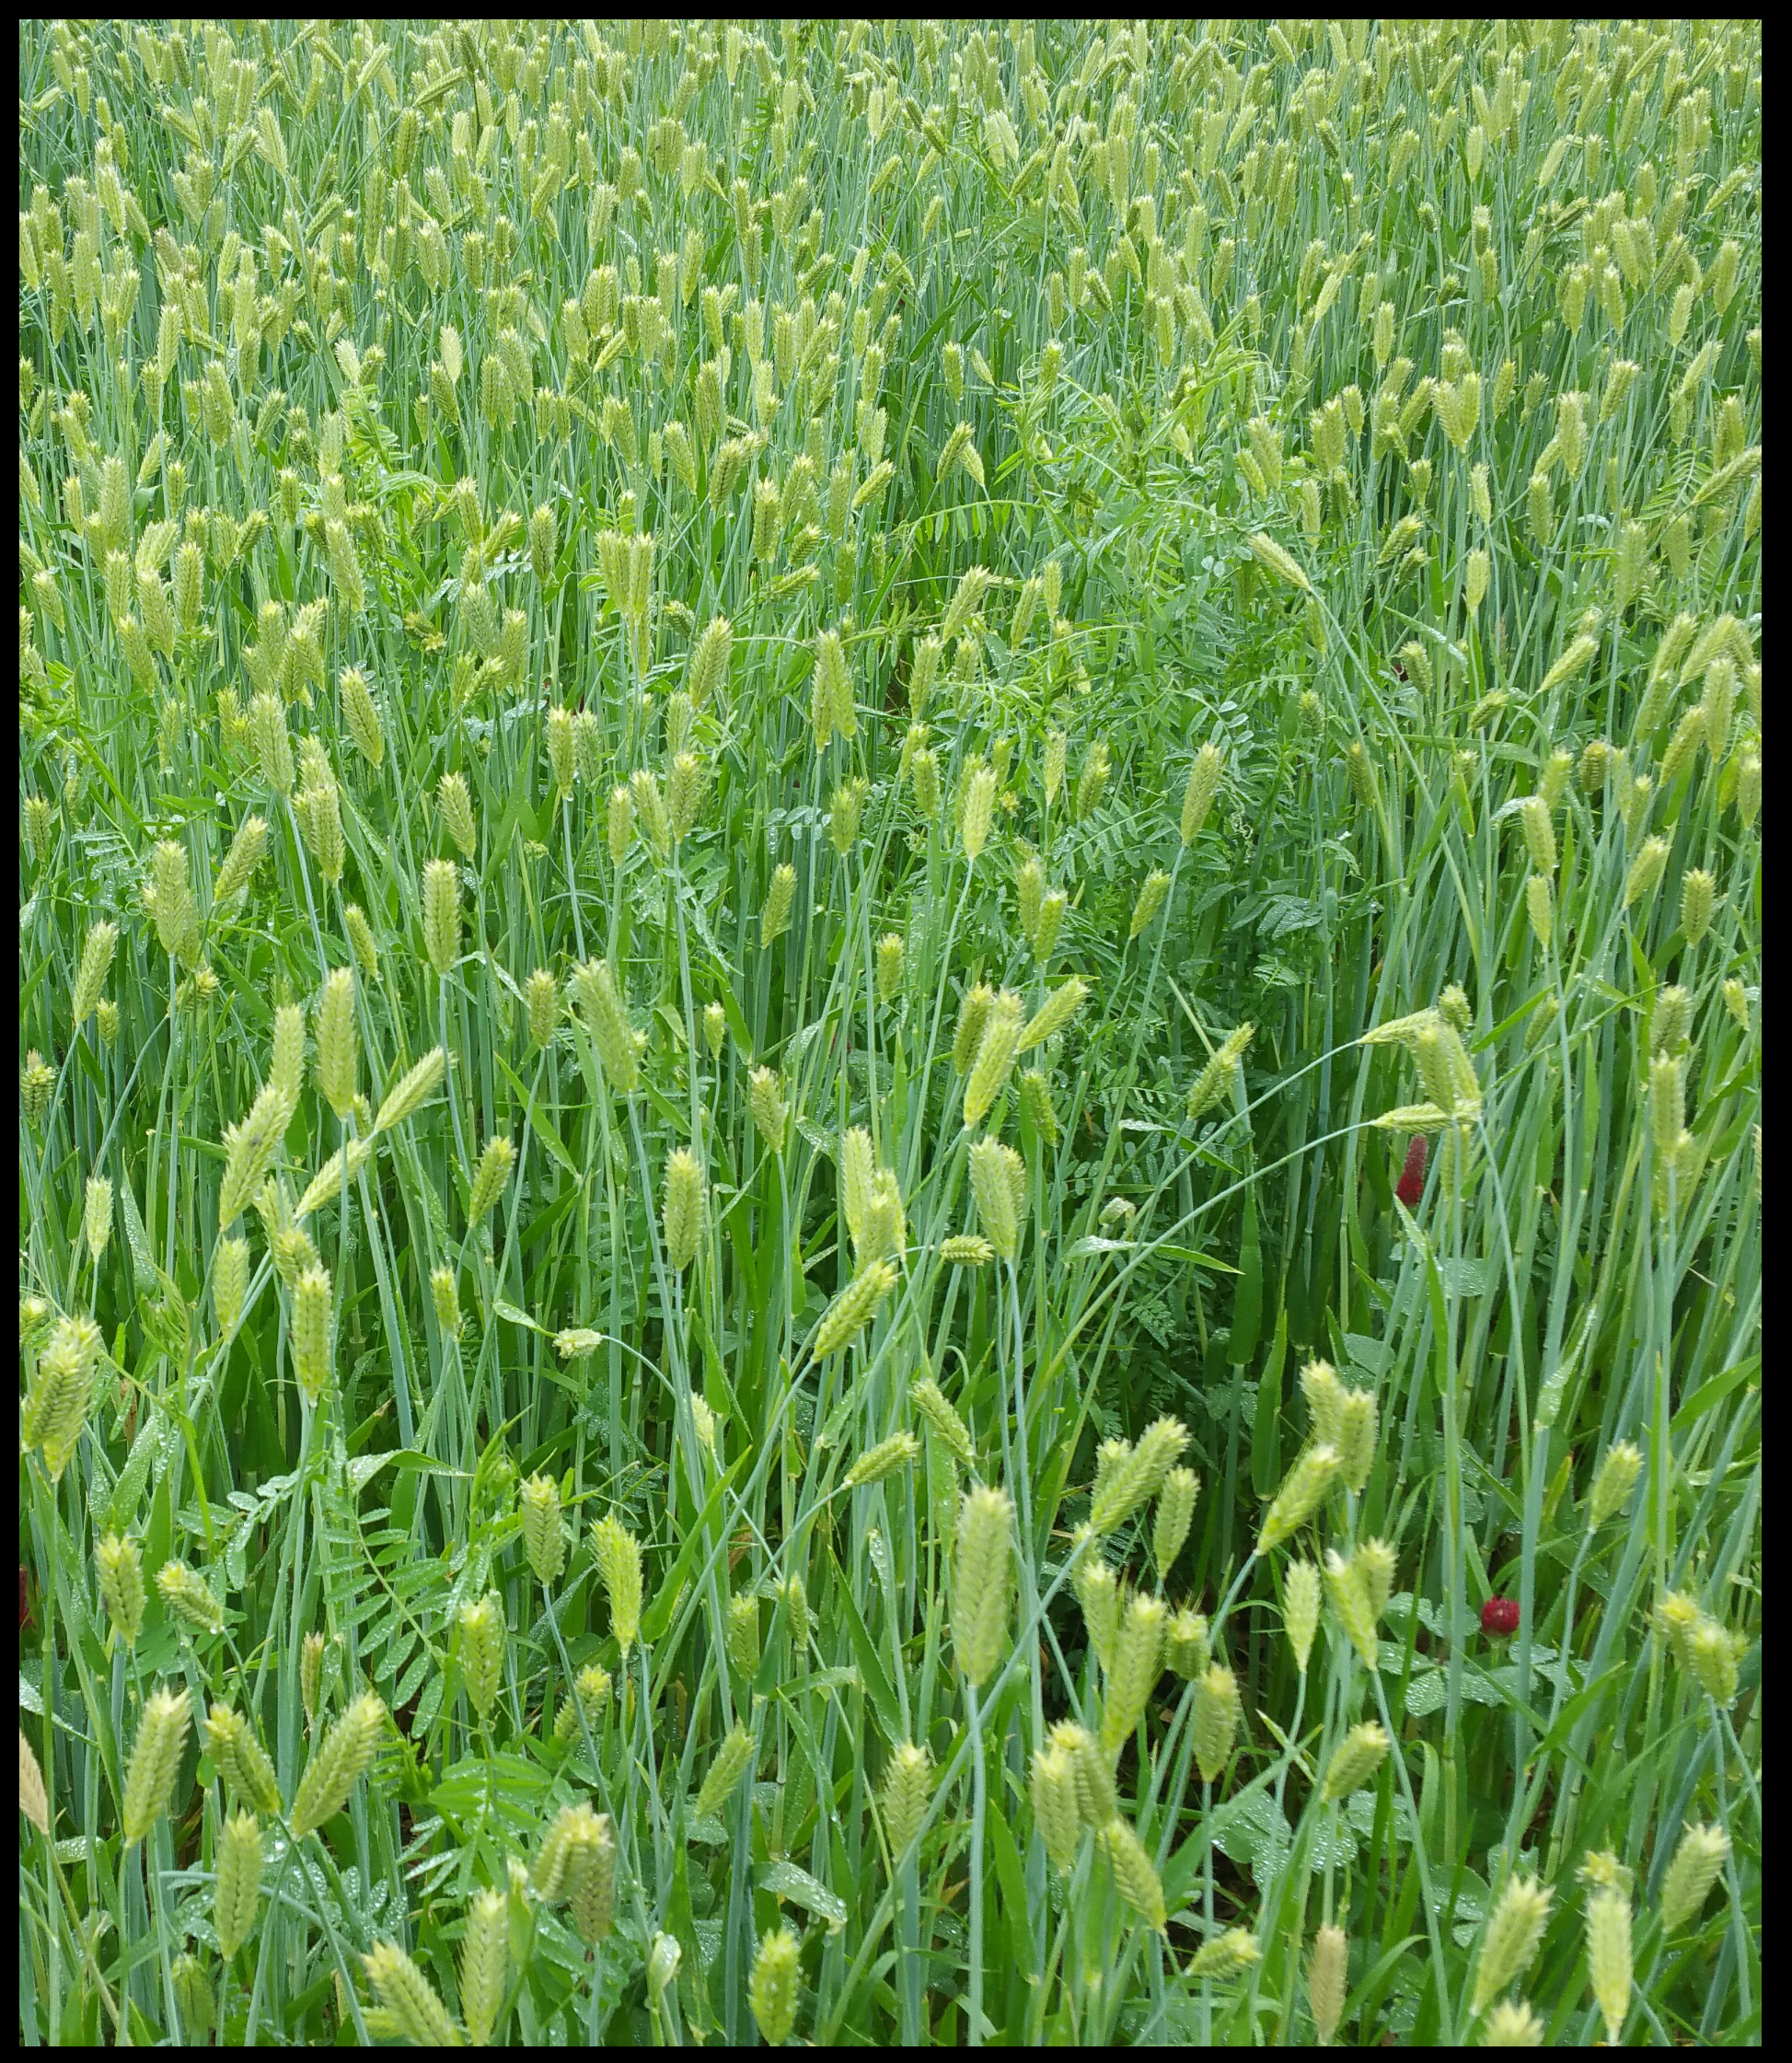
Cover Crop Calculator
This soil health calculator allows users to estimate soil property changes that can result when growing winter cover crops
Instructions for use
- Select climate type
- Select soil texture group
- Select cash crop (for monocultures) or crop rotation
- Select the desired cover crop species or mixture
- Select desired output parameters
- Click Calculate

Note: This Soil Health Calculator provides estimates based on overall average values of measurements reported in more than 500 studies. These studies represent a range of cropping systems and times since implementation of winter cover crops. Therefore, actual results will likely vary.
Climate
Enter climate here:
Soil Texture
Soil textures are grouped based on the Cornell Comprehensive Assessment of Soil Health (CASH) framework.
- Coarse: sand, loamy sand, sandy loam
- Medium: loam, silt loam, silt, sandy clay loam
- Fine: clay loam, silty clay loam, sandy clay, silty clay, and clay
Cash Crop
Cash crops are grouped into the following categories:
- Monocultures: corn; soybean; wheat; vegetables
- Rotations: corn-soybean; corn-soybean-wheat
- Other (monocultures or rotations)
Select the cash crop type:
Cover Crop
Cover crop types are grouped into the following categories:
- Grasses: examples include cereal rye, barley, wheat
- Legumes: examples include hairy vetch, crimson or red clover, winter pea
- Other: single-species cover including brassicas (e.g., rapeseed, radish) and sunflowers
- Multi-species mixtures
Select the cover crop type:
Parameter
Average change (%)
Cash crop yield for the season following winter cover crops.
Positive (+) values mean that on average the cash crop will have a higher yield
Cash crop yield
Mass of soil particles within a given volume.
Negative (-) values are associated with more pore space and less compaction
Bulk density
N/A
Organic matter associated carbon in soil.
Positive (+) values are associated with greater soil water holding capacity and better structure
Soil organic carbon
N/A
Amount of nitrogen in the soil, including inorganic and organic forms
Positive (+) values mean that less inorganic nitrogen may be required for the cash crop(s)
Nitrogen
N/A
Ability of soil aggregates to hold together during disturbances such as rain.
Positive (+) values indicate greater stability and more resistance to erosion and crusting
Aggregate stability
N/A
Rate at which water can enter into the soil.
Positive (+) values indicate that soil will absorb more water and have less overland flow during rain
Infiltration rates
N/A
Saturated hydraulic conductivity, which controls the rate of water movement through soil.
Positive (+) values indicate that water will move with less resistance into and through soil
Ks
N/A
Movement and/or loss of soil due to wind or rain.
Negative (-) values mean that less soil is affected by erosion
Erosion
N/A
Water that ponds up on the soil surface and moves as overland flow.
Negative (-) values means less overland flow, meaning less erosion and greater replenishment of soil water
Runoff
N/A
Water that drains below the root zone.
Negative (-) values mean less leaching, which can reduce loss of fertilizers and herbicides/pesticides from soil
Leaching
N/A
Biomass associated with weeds during the following cash crop growing season.
Negative (-) values mean that fewer weeds were found in the field after cover crops
Weeds
N/A
Carbon associated with soil microbes.
Positive (+) values are associated with beneficial biological functions and more plant available carbon
Microbial biomass C
N/A
Nitrogen associated with soil microbes.
Positive (+) values are associated with beneficial biological functions and more plant available nitrogen
Microbial biomass N
N/A
Click on the triangles above to see more information, including how to interpret each parameter